Value Stream Mapping as a Management Tool: From Process Visualization to Improvement Decisions
Value Stream Mapping is often introduced as a Lean technique for representing the flow of materials and information across a process. That description is correct, but incomplete. For a Plant Manager, Operations Manager, or Production Manager, the real value of VSM lies elsewhere: it provides a structured basis for deciding where improvement efforts should be concentrated.
A map alone does not improve a process. Its usefulness depends on the quality of the interpretation that follows. The managerial question is therefore not simply “What does the process look like?” but “What is preventing the value stream from flowing as it should, and which issue should be addressed first?”
Used in this way, VSM becomes more than a Lean template. It becomes a shared improvement language that connects operational evidence, process performance, and management priorities.
Why Value Stream Mapping Is More Than a Lean Exercise
A Value Stream Map represents the activities and flows required to move a product, service, or information stream from one point to another. In manufacturing environments, it commonly combines the physical flow of materials with the information that controls production.
The risk is to treat this representation as the end result.
Teams may spend considerable effort collecting data, drawing symbols, calculating times, and producing a detailed current-state map. Once the workshop ends, however, the map is sometimes filed away or displayed on a wall without materially affecting operational decisions.
That happens when VSM is approached mainly as a documentation exercise.
From a management perspective, the map should instead answer practical questions:
- Where does the process stop or slow down?
- Where is inventory accumulating?
- Which activities contribute directly to the required output?
- Which delays dominate the total lead time?
- Where are decisions or information flows creating instability?
- Which local inefficiencies are actually relevant to the performance of the entire value stream?
These questions change the role of VSM. The objective is no longer to create an accurate picture for its own sake, but to make the relationships between problems visible.
This distinction matters because managers rarely lack improvement opportunities. More often, they face the opposite problem: too many possible actions and limited resources.
A useful VSM helps establish priorities.
What Managers Should Read in a Value Stream Map
The first managerial skill associated with VSM is not drawing the map. It is reading it.
An experienced reader does not interpret every symbol with the same level of importance. Instead, the map is examined as a system of connected conditions: production steps, waiting periods, inventories, information signals, handovers, operating times, and interruptions.
The central question is how these elements influence the overall flow.
Material Flow and Information Flow
Material flow shows how products, components, or work move through the process. Information flow shows how activities are triggered, scheduled, coordinated, or authorized.
Looking only at the material side can produce an incomplete diagnosis.
A production area may appear to suffer from excessive work-in-process inventory, for example. The visible accumulation is a material-flow symptom, but its causes may lie elsewhere: batch scheduling, planning frequency, release policies, unstable priorities, poor synchronization, or upstream information.
This is one reason VSM is useful beyond the Lean function. It connects physical operations with the management system that drives them.
For a Plant Manager, this makes the map particularly relevant. A local problem may be generated by a decision taken several steps away from the place where its consequences become visible.
VSM helps expose that relationship.
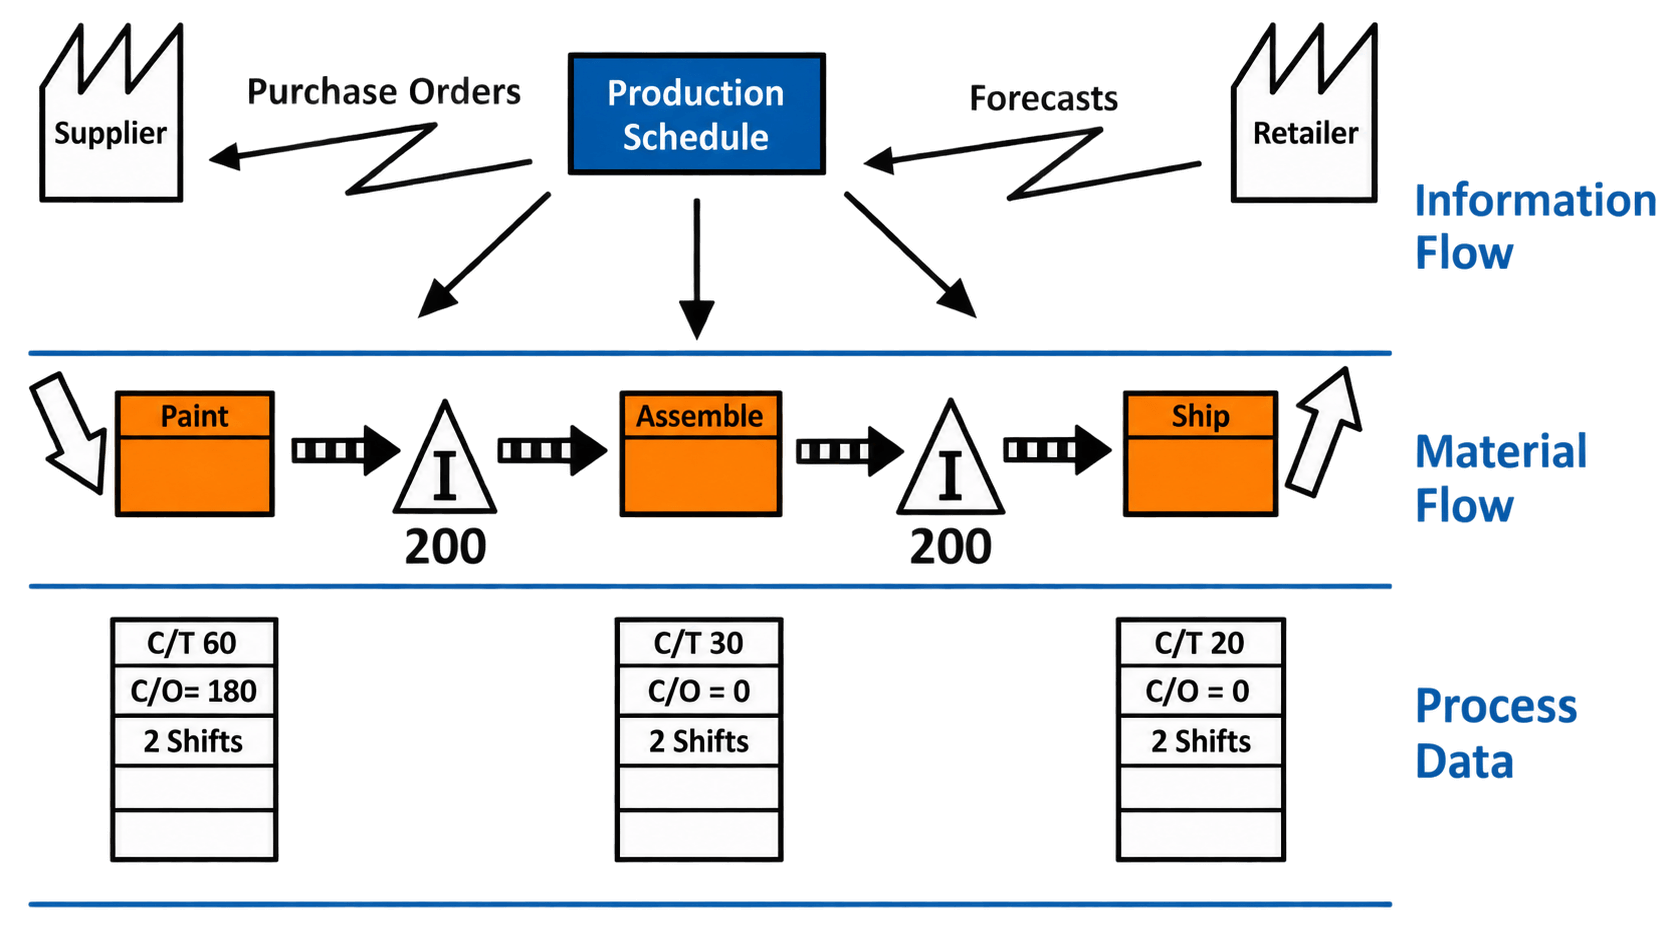
Times, Waiting, and Inventory as Process Signals
A process rarely spends all its elapsed time performing value-creating work.
Products wait between operations. Orders wait for approval. Components remain in queues. Information is transferred between functions. Production may be interrupted while the next activity waits for material, capacity, authorization, or instructions.
The contrast between processing time and total elapsed time is therefore one of the most useful readings of a Value Stream Map.
This does not mean that every waiting period must automatically be eliminated. It means that waiting should be treated as a signal requiring interpretation.
Inventory deserves the same attention.
Inventory between process steps may indicate protection against variability, imbalance between operations, large batches, synchronization problems, or scheduling practices. The important managerial question is not simply whether inventory exists, but why the system needs it.
A map that makes these relationships visible provides a better foundation for improvement than a list of isolated efficiency indicators.
Metrics That Help Separate Local Problems from Flow Problems
Metrics in VSM are useful when they help explain the behavior of the value stream.
They become less useful when data collection expands without improving the quality of the decision.
The objective is not to measure everything. It is to identify the variables that reveal how work moves through the system and where the main losses occur.
Lead Time and Processing Time
Lead time describes the elapsed time required for work to move through the value stream. Processing time represents the periods during which an operation is actually being performed.
The relationship between these two measures can reveal an important managerial reality: improving the speed of one operation may have limited impact if most of the total lead time is generated by queues, waiting, handovers, or inventory.
Consider a simplified example.
A production flow requires several days from release to completion, but the actual transformation activities account for only a relatively small portion of that period. Reducing one machining operation by a few seconds may be technically successful, yet strategically marginal.
The VSM directs attention to the larger question: where is the elapsed time really being created?
That changes the improvement discussion from local efficiency to end-to-end performance.
Accumulations, Waiting, and Flow Discontinuities
Work-in-process inventory and queues often reveal where operations are not synchronized.
The interpretation should remain contextual. A buffer may exist deliberately to protect a critical process, while another accumulation may simply result from batch production or inconsistent scheduling.
The map therefore should not be read as a catalogue of “waste symbols.” It should be read as evidence of system behavior.
Managers can use that evidence to distinguish three situations:
- a problem that affects only one operation;
- a problem that propagates into other stages;
- a problem that limits the performance of the entire value stream.
The third category usually deserves the greatest management attention.
This distinction helps avoid one of the most common improvement errors: investing heavily in a visible local inefficiency that has little effect on total flow.
From the Current-State Map to Improvement Priorities
The current-state map should describe how the process actually operates, not how procedures suggest it should operate.
This principle is essential.
If the map represents the formal process instead of the real one, the resulting improvement priorities will be based on assumptions. For that reason, VSM normally requires direct observation, operational data, and input from the people who manage or perform the work.
Once the current state is visible, the next step is interpretation.
The purpose is not to generate the longest possible list of waste. It is to identify the few conditions that most strongly affect flow, responsiveness, stability, or performance.
Identifying Constraints That Affect the Entire Value Stream
A process contains many inefficiencies, but they do not all have the same managerial relevance.
Suppose one workstation has a minor setup inefficiency, while another stage creates a persistent queue that determines the throughput of the entire flow. Both problems may be real, but they should not automatically receive equal priority.
A managerial VSM encourages the team to evaluate problems according to their systemic impact.
Useful questions include:
- Does this issue increase total lead time?
- Does it generate inventory elsewhere?
- Does it create instability downstream?
- Does it reduce the ability of the process to respond to demand?
- Does solving it remove a constraint or merely improve a local metric?
- Will the improvement remain effective if surrounding conditions do not change?
This perspective reduces the risk of fragmented improvement programs in which each department optimizes its own performance while the end-to-end process remains substantially unchanged.
Designing a Future-State Map Around Decisions
The future-state map is not simply a cleaner version of the current-state map.
It represents a deliberately different operating logic.
The aim is to define how work should flow after the most relevant causes of delay, imbalance, excess inventory, or coordination problems have been addressed.
A useful future state should therefore make management choices explicit.
These may concern, for example, how work is released, where production is controlled, how processes are synchronized, where buffers are necessary, how frequently information is exchanged, or which steps need structural improvement.
The value of the future-state map lies in its ability to create a coherent direction.
Without that coherence, organizations can launch several Lean initiatives at the same time without knowing whether the individual actions reinforce one another.
The future-state map provides the common reference.
An Interpreted VSM Example from a Management Perspective
Consider a hypothetical production flow with four main stages: component preparation, machining, assembly, and final inspection.
The machining activity is technically efficient and has a relatively short cycle time. Nevertheless, a large quantity of work-in-process inventory is consistently found before assembly.
A purely local analysis might conclude that assembly needs to work faster.
A VSM-based analysis would ask broader questions.
Why is inventory building before that stage? Is machining producing in batches larger than the downstream process can absorb? Is assembly capacity unstable? Is production being released according to a forecast rather than actual downstream demand? Are priorities changing during the day? Is missing material causing interruptions?
The visible inventory is not yet the diagnosis. It is evidence.
What the Current State Reveals
Assume that the map shows three relevant characteristics.
First, machining produces in large batches. Second, assembly receives work according to a schedule that is updated independently from the actual upstream flow. Third, significant waiting occurs before final inspection.
The map now presents a more useful picture.
There may be several technically valid projects available: reduce machining cycle time, reorganize the assembly area, automate an information transfer, increase inspection capacity, or reduce batch sizes.
The management task is to understand which changes would improve the entire flow rather than only one stage.
If machining is already producing faster than assembly can consume, increasing machining productivity may create even more inventory.
A local improvement could therefore worsen the value stream.
Turning the Evidence into Operational Priorities
A better improvement sequence might begin by addressing synchronization.
The team could first investigate the logic that determines batch size and work release. It could then examine the causes of instability in assembly and determine whether the waiting before inspection represents a structural constraint.
The point of the example is not to prescribe a universal solution.
Different factories would require different actions.
The important lesson is that VSM changes the sequence of reasoning:
observation comes before intervention, flow comes before local optimization, and priority comes before the accumulation of improvement projects.
That is the managerial value of the tool.
Mistakes That Turn VSM into a Static Document
A technically correct Value Stream Map can still be managerially weak.
This usually happens when the organization focuses on the mechanics of mapping rather than the purpose of the exercise.
Mapping Too Much Detail Without a Decision Question
More detail does not automatically produce more insight.
A map can become so complex that the important relationships disappear inside operational information.
Before mapping, the team should understand what it is trying to learn.
Is the objective to reduce lead time? Improve responsiveness? Understand excessive inventory? Identify the cause of unstable flow? Prepare a future-state design?
The question influences the level of detail required.
VSM should contain enough information to support analysis without becoming an exhaustive process database.
Optimizing Individual Areas Instead of the Overall Flow
Functional silos are one of the strongest reasons for using VSM.
Production, planning, logistics, quality, maintenance, and other functions often manage their own indicators. Each department may therefore pursue improvements that appear rational from its own perspective.
The result can still be a poorly performing value stream.
A department may maximize equipment utilization by producing larger batches, for instance, while downstream areas experience increasing inventory and longer lead times.
VSM introduces an end-to-end perspective.
This does not eliminate functional metrics, but it helps managers assess them against a wider question: does this improvement make the overall value stream perform better?
Treating the Current State as the Final Deliverable
Another common error is ending the exercise after the current-state map has been completed.
At that point, the team has produced analysis but not necessarily improvement.
The managerial value emerges when the map supports a future state, clear priorities, responsible ownership, and follow-up actions.
A current-state map should therefore be considered a diagnostic instrument, not the final output.
Failing to Update the Map as Conditions Change
Processes evolve.
Demand changes, product mix changes, resources are reconfigured, systems are modified, and previous improvement actions alter the flow.
A VSM that is never revisited gradually loses relevance.
This does not mean maps need continuous redesign. It means they should remain connected to the improvement cycle rather than becoming permanent representations of a process that no longer exists.
VSM as a Shared Language for Plant Management, Operations, and Lean
Value Stream Mapping is not useful only to Lean specialists.
Lean professionals may facilitate the methodology, but the information represented in the map concerns decisions owned by several functions.
Plant Managers need visibility over end-to-end operational performance. Production Managers need to understand how individual areas interact. Operations Managers need to connect service levels, capacity, inventory, and responsiveness. Planning teams influence the information flow. Frontline teams understand the practical causes behind many of the conditions visible on the map.
VSM provides a common object around which these different perspectives can meet.
That matters because cross-functional problems are difficult to manage through isolated reports.
One department sees excess inventory. Another sees scheduling instability. A third sees capacity loss. A fourth sees late orders.
A value-stream perspective can reveal that these are not separate problems but different manifestations of the same operating condition.
The map therefore becomes a management language.
Its value lies not only in what it represents, but also in the quality of the discussion it makes possible.
A Practical Sequence for Using Value Stream Mapping in Decisions
An effective managerial use of VSM can be organized around a relatively simple sequence.
Start by defining the value stream and its boundaries. The scope must be broad enough to reveal relevant dependencies but specific enough to remain manageable.
Then observe the current process directly. The map should reflect actual operating conditions rather than assumptions or formal procedures.
Collect only the data needed to understand flow. Depending on the process, this may include cycle times, waiting periods, inventory, changeovers, availability, information triggers, batch sizes, or other relevant operating conditions.
Build the current-state map and read it as a system. Look for connections between information, materials, queues, instability, and delays.
Identify the issues with the strongest effect on overall performance. Avoid treating every inefficiency as an equal priority.
Design a future state that reflects a more coherent operating logic rather than a collection of isolated improvements.
Finally, translate the future state into actions, responsibilities, and review points.
The sequence is simple in principle. The difficulty lies in interpretation.
That is why practical VSM capability goes beyond knowing the standard symbols. It requires the ability to connect operational evidence with improvement logic and management decisions.
Frequently Asked Questions About Managerial Use of VSM
Is VSM Useful Only for Lean Specialists?
No. Lean specialists often have deeper methodological knowledge of Value Stream Mapping, but the map is particularly valuable when it is used cross-functionally.
Plant Managers, Operations Managers, Production Managers, planners, and other operational roles can use VSM to understand dependencies, compare priorities, and evaluate the effect of improvement initiatives on the entire flow.
The methodology becomes stronger when it is not isolated inside the Lean function.
How Often Should a Value Stream Map Be Updated?
There is no universal update frequency that applies to every organization.
A map should be reviewed when relevant operating conditions have changed enough to affect its usefulness as a representation of the process. Major improvement actions, changes in demand patterns, process redesign, layout changes, new planning rules, or significant capacity adjustments may all justify a new assessment.
The practical criterion is relevance: the map should describe the value stream closely enough to support current decisions.
What Is the Difference Between a Useful VSM and a Simple Process Snapshot?
A process snapshot describes what exists.
A useful VSM supports interpretation.
The distinction lies in whether the map allows the team to understand relationships between activities, information, waiting, inventory, and overall flow, and whether that understanding leads to improvement priorities.
A detailed map with no decision behind it may remain descriptive. A simpler map that clearly reveals the causes of poor flow may be much more valuable.
Can VSM Be Used Outside Manufacturing?
The underlying logic of VSM can be applied wherever work, information, or materials move through a sequence of activities.
The specific representation and relevant metrics may change, but the managerial objective remains similar: understand the end-to-end flow, identify delays and handovers, distinguish value-creating activity from waiting or rework, and define a better future state.
The method should be adapted to the characteristics of the process rather than copied mechanically from a manufacturing example.
From Lean Template to Improvement Language
The strongest use of Value Stream Mapping begins when the organization stops treating the map as the objective.
The drawing is only the visible part of the work.
The real contribution comes from the questions it forces managers to address: where time is being lost, why inventory exists, which signals govern the process, where instability is generated, which local improvements have little systemic effect, and which changes can alter the performance of the entire value stream.
This is also why practical VSM competence matters.
Knowing how to construct the map is necessary, but it is not sufficient. The more advanced capability is learning how to interpret it, challenge assumptions, connect flow metrics with operational causes, and translate the resulting evidence into a coherent improvement path.
When used in this way, Value Stream Mapping moves from being a Lean exercise to becoming a management tool for clearer, more disciplined improvement decisions.
About Advance School: Advance School is the only Premier ELITE Partner of APICS in Switzerland, and has trained worldwide thousands of professionals from all organizational levels in the Operations and Supply Management areas.
News from Advance
Return to the List


Bologna, Italy
Via Massimo D’Azeglio, 35 – 40123
Tel: +39 051 19907026
Mobile: +39 3775773275
Mail: info@advanceschool.org
© 2026 Advance Operations Management School GmbH – UID: CHE-221.069.731 - share capital 20'000.00 CHF